Technical analysis is still essential when analyzing before buying or selling financial assets.
Cryptos with high volatility still do not escape technical analysis because they often make it easier for analysts to predict price movements.
In technical analysis, there are charts where candlesticks in a chart form patterns that signify potential further movements.
This article will explain one of the often used technical analysis patterns, namely, the triangle pattern.
Getting to know the Triangle Pattern
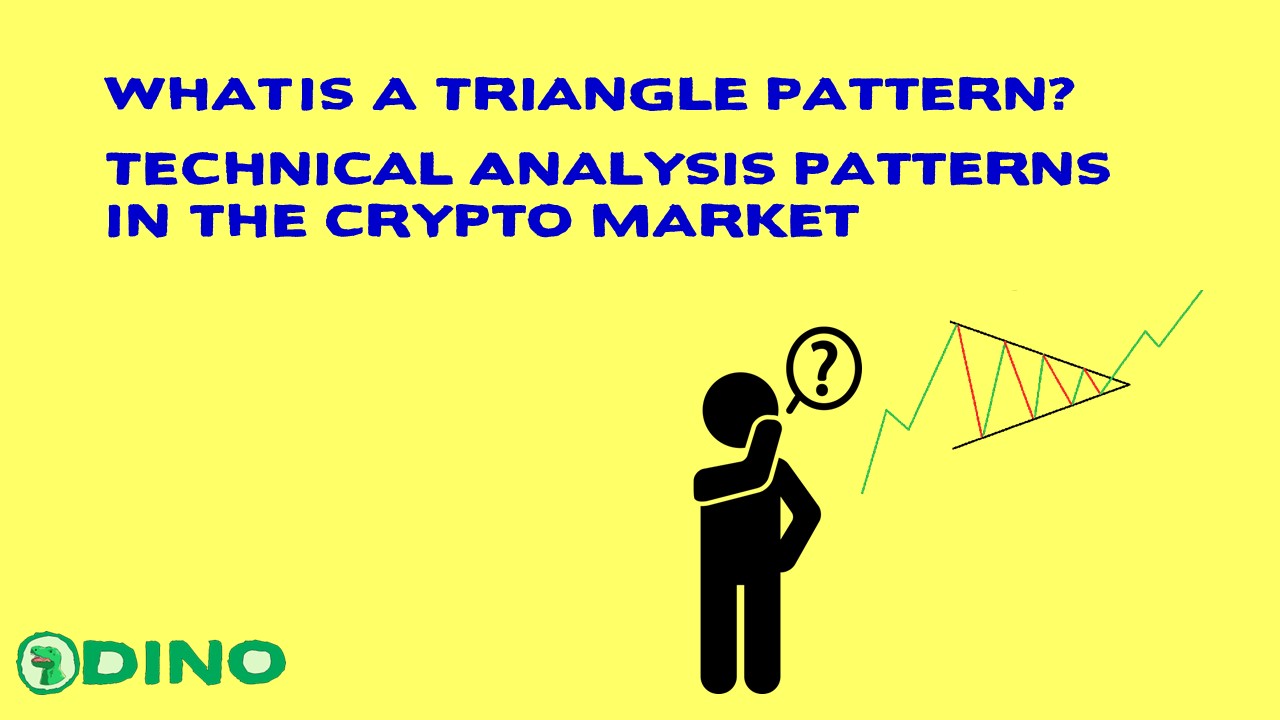
The triangle pattern is a graphic pattern in technical analysis that makes the candlestick move as if it were in the form of a triangle.
The triangle shape provides an upper limit or resistance and a lower limit or support for price movements.
Over time, a trend will move conical to form a triangle in this pattern.
The upper limit in the movement of this pattern is drawn by connecting the highest closing prices of several candlesticks. Instead, the lower limit will be drawn by connecting the lowest closing price of several candlesticks.

This triangle pattern can be used to see the continuation of the direction of the movement after going against the law of the previous direction, commonly called continuation.
In addition, this pattern can also be used to see potential opposite directions or reversals so that if equipped with candlestick analysis, this pattern is a solid predictive strategy.
Characteristics of the Triangle Pattern
This triangle chart pattern has three main characteristics that can be seen from price movements or trends.
There are three characteristics depicted in the trend: one direction followed by consolidation and then moving in the determining direction.
The first direction or first characteristic is to move up or down drastically.
Generally, there is a high volume of this movement, which occurs quickly. So when this movement occurs, naturally, the price will move quite significantly in percentage, whether it is up considerably or down especially.
The second direction, the second and main characteristic, is consolidation. After the drastic movement, there will generally be consolidation or sideways movement without a clear path.
This consolidation became the main movement because the triangle pattern is generally drawn in this consolidation.
After consolidation, the third direction of movement emerged, which became the last characteristic, a new path of action that occurred stably. Traders often use the second characteristic to prepare the position to be opened so they can enjoy it in the third move.
Types of Triangle Pattern
This triangle pattern has three types that can be used to help predict the next price direction.
Ascending Triangle
Ascending triangle or triangle pattern that moves up is a pattern to predict the potential movement of appreciation.
This pattern is categorized as a bullish pattern or a pattern that provides a potential for positive movement.

Generally, this pattern will be described by three movements. The first is an upward movement or initial appreciation that occurs impulsively or significantly.
Furthermore, the movement will be followed by a consolidation that forms a triangle. But the triangle will move up so that it creates a conical upwards.
Generally, this triangle will be formed with support moving up with straight sideways resistance. This pattern opens long when the price breaks out of the resistance.
Descending Triangle
Descending a triangle or triangle pattern that moves down is a pattern to predict a potential movement of depreciation or correction.
This pattern falls into bearish patterns or patterns that provide the potential for damaging or downward movement.

Generally, this pattern will be described by three movements. The first is a downward movement or initial depreciation that occurs impulsively or significantly.
Furthermore, the movement will be followed by a consolidation that forms a triangle.
But the triangle will move down so that it includes a downward cone.
Generally, this triangle will be formed with support moving in a straight line with resistance moving down. This pattern opens a sell or short position when the price breaks out of the linear moving support.
Symmetrical Triangle
It is a symmetrical triangle pattern where this pattern can provide an up or down movement. Unlike the previous two triangles, the image of this symmetrical triangle is thesame as its name, which is balanced.

That is, support and resistance will be drawn to meet at the midpoint, where support is a line moving up, and resistance is a line moving down.
Traders will use this symmetrical triangle pattern to predict a relatively long consolidating move. So generally, traders will wait for a breakout or price to get out of this balanced triangle zone.
Often there will be a false breakout or a brief exit before exiting in the opposite direction.
For example, there is a possibility that when an upward breakout occurs, the movement will be the beginning of a correction because, after that, it will escape downwards or vice versa.
How to Use the Triangle
Pattern
Generally, traders will use stop loss and take profit to open positions automatically when theywant to take profits or cut losses.
An example will be used with the ascending triangle pattern. With the ascending triangle, the trader will open a position when there is a breakout, place a stop loss, and take profit at the nearest support and resistance.
Traders may open and take profit positions at the nearest resistance or high before the ascending triangle pattern occurs.
For stop losses, traders generally adjust to their respective strategies and risk plans but open astop loss position close to the triangle pattern.
Overall, this strategy must also be paired with personal risk management to adjust to the ability of each loss percentage and profit target.
By reading this article, analysts can have a basic idea of the triangle pattern and how to use it.
More News About Crypto : NEWS
Follow our Twitter : https://twitter.com/DinoDapps


