It is one of the methods used in trading financial assets, including crypto, to perform analysis. What is it, and how do you use it?
This analysis is generally used with candlestick charts for easy understanding; this support and resistance can be seen in a trend or price movement zone.
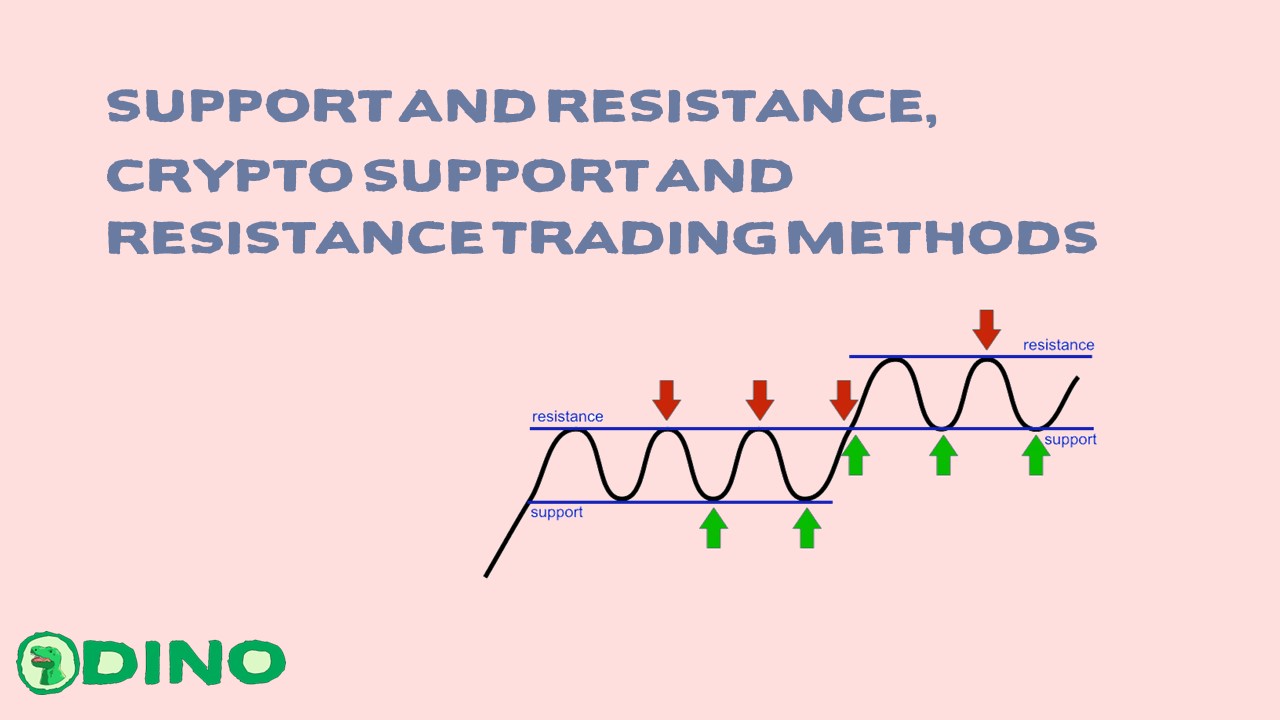
Support is the lower limit of the zone that serves to hold or prevent the price from falling further when the price trend is down. After touching this zone, it is expected that the price will rise again. Resistance is the zone’s upper limit that keeps the price from going higher when the price trend is positive.
Price Zones in Support and Resistance
As is well known, in technical analysis, there are three trends or zones of price movement, namely up, down and sideways or consolidation. The three zones have different support and resistance according to the direction of movement.

Examples of support and resistance can be seen in the picture above, where there is support and resistance for the three types of ongoing trends: up, sideways, and down.
Functions of Support and Resistance when Trading
Determine the Time to Buy and Sell
The purpose of support and resistance is to determine which zones are used to make transactions. Generally, support is a price area to buy, and resistance is a price area to sell.
Traders or analysts generally buy when the price is in the lower limit area of a trend, and vice versa, will sell when it is in resistance.
But as is known, the trend or direction of price movement will not always be the same because it can change between the three types of trends previously mentioned.
Thus, support can turn into resistance when prices move down after moving up and conversely, resistance can turn into an asset when prices move up after moving down.
An example can be seen in the picture above, where the price moves from left to right, which creates new support and resistance.
It can be seen that the support and resistance depicted by black lines can act as places to buy and sell. With this understanding, the price limit can also be used to see a potential trend reversal or reverse direction from rising to falling or vice versa.
Risk Management
Traders often use support and resistance for risk management, where support is used to cut losses if the analysis is wrong, and resistance is used to take profits.
Using these two limits can also keep traders psychologically from being greedy or complacent when they get high losses or profits.
Often when the trader’s analysis is wrong, the trader will allow his position to lose more than his tolerance limit in the hope that the price will rise again. Conditions often end in margin calls or run out of funds due to losses.
On the other hand, when they are profitable, traders can fall asleep because they feel that prices will rise higher. But in reality, after touching the target and not stopping trading activities, the price will reverse direction and cause losses. So by understanding this support and resistance, traders can maintain discipline and eliminate the greed aspect of a trader’s psychology.
How to Find Support and Resistance
There are several ways to determine support and resistance when analyzing financial markets, including crypto. However, there are three most common ways that analysts and traders often use to find a reasonable price limit.
Using Fibonacci
The first is to use the Fibonacci Extension or Fibonacci Retracement, a tool to perform technical analysis using numbers.
In the Fibonacci Retracement, several number points are generally used to determine support and resistance. This number can be written as a percentage or in ordinary numbers, namely 0.236 or 23.6%, 0.382 or 38.2%, 0.618 or 61.8%, 0.764 or 76.4%, up to 1 or 100%.
After that, the number is generally continued with the Fibonacci Extension.
Fibonacci Extension is usually used as a target to take profits.
The most common numbers in the Fibonacci Extension are 1,000 or 100%, 1,618 or 161.8%, 2,618 or 261.8%, 3,618 or 361.8%, and 4,236 or 423.6%.
As an example of its use, in a downward movement, the Fibonacci Retracement can be drawn by drawing a line from the highest price to the lowest price of the trend or price movement. For an upward direction, the trader can do the opposite.

This method is not a method that is always the same among traders. There are two sides of the trader who do the opposite.
For example, the Fibonacci Retracement is drawn in a downward movement. In an upward trend, this trader does the opposite.

The point is that traders or analysts will use the numbers in the Fibonacci as support and resistance, depending on the current price movement.
Using Indicators
The second way is to use indicators such as the Moving Average to determine support and resistance.
An indicator is a line formed by mathematical or statistical calculations based on previous price movements. Generally, this indicator is used to predict future price movements.
One of the most frequently used indicators is the Moving Average, which is the most commonly used indicator to see price movements. Generally, indicators are used as tools when conducting technical analysis, especially when determining support and resistance. The reason is that if you only use one indicator, the price limit will not be visible.

If you only use one Moving Average, the price limit will be less precise but can still be used for analysis. The Moving Average line can be used to determine the target so that it can still be used.
Drawing Manually
Lastly is to draw support and resistance manually via the drawing tools available on Tradingview.
When drawing manually, to determine support and resistance, make sure the boundary area is an area frequented by price.
If the price often visits the boundary and then moves in the opposite direction or there is a rejection, most likely, the area is a support or resistance area.
Generally, the limit is an area filled by many candlestick axes and filled by the close of the candlestick body. When drawing manually, please note that there are two ways: using a trend line or a line and seeing which areas the candlestick frequently touches. An example is in the image below.

Please note that technical analysis, including the determination of support and resistance, is a matter based on the perspective of each analyst.
This statement is also why, in the financial market, some predict prices will go down, and others will go up. That’s the explanation about support and resistance; it should be noted that these indicators are not sufficient to provide accurate analysis results and need to be added with other analytical methods.
More News About Crypto : NEWS
Follow our Twitter : https://twitter.com/DinoDapps